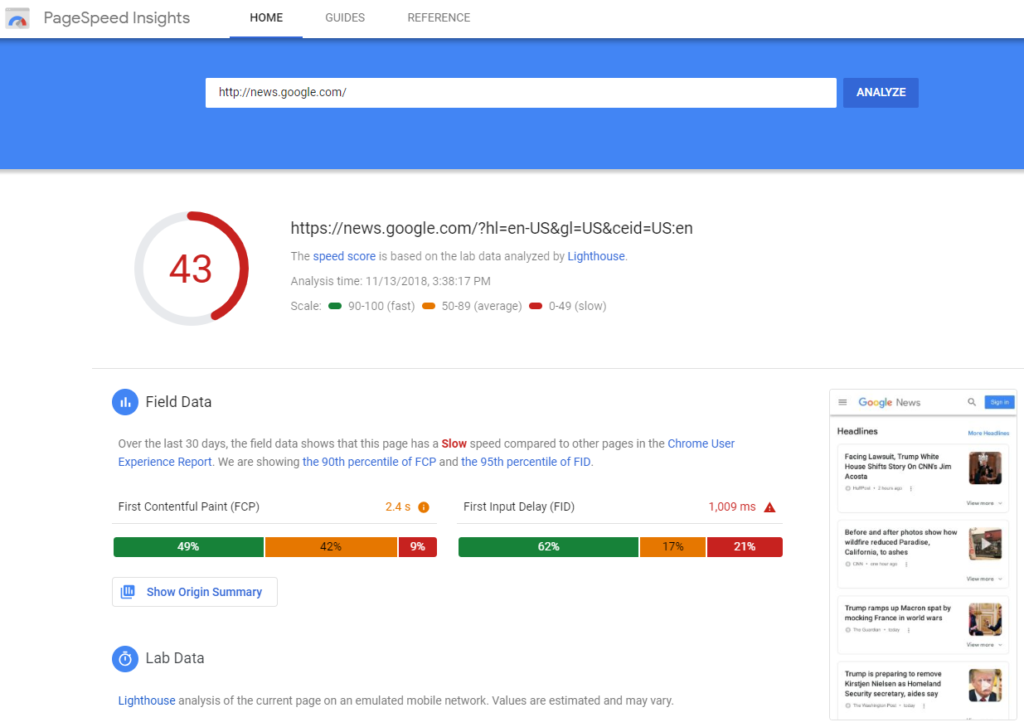
Google recently decided to update its Google Page Speed Insights report. Companies that were consistently scoring in the 80s with their old tool, are now scoring in the 20s and 30s. The scoring is so heavy-handed, even Google’s sites (which use very minimalistic page styling) show poor scores! Their own News Site is scoring a 43—“slow” as of this writing. So, don’t feel like your SEO world is ending when you check your new score.
So, why the big change?
This new version is putting a lot of weight into data queried from Project Lighthouse. In short, Project Lighthouse is an open-source tool Google is developing to annoy webmasters “improve the quality of web pages”. It has audit scores for performance (“speed”?), progressive web apps, accessibility, and more. It would appear that the ‘speed score’ you get via the webpage version is roughly equivalent to the ‘performance score’ as it’s referred to in the other versions. And the suggestions mirror one another. The Speed/Performance score is the main thing that Google has chosen to draw attention to in the webpage version of the report, so it’s going to get the lion’s share of the screen time today. After reflecting on the information I’m about to share with you, I’m reminded of a quote popularized by Mark Twain, “There are three kinds of lies: lies, damned lies, and statistics.” Let’s get started!
How does Google get this score?
The report tries to emulate the experience the average mobile consumer would have visiting the website from a “simulated fast 3G data connection”. Yes, I said that right – 3G. The very same cell phone technology that came on the scene in 1998 when Bill Clinton was in the middle of his second term. The same connection you get when you’re camping out in the woods and you can only make and receive the occasional SMS text! It’s no wonder the scores are atrocious. Google specifically states they use the Moto G4 as benchmark for the average user and define it as a “mid-tier device”. I would agree that it was mid-tier… when it debuted 2 and a half years ago. So, if you’ve purchased any Samsung Sx or iPhone device since then, you’ll have a better experience than what they’re testing as, even if you were on 3G speeds.
Google has mentioned previously that you should test your website performance with lower data speeds. Part of the reason behind that is 3G is still the lowest common denominator for website connections globally. For example, much of India still relies on that quality (or less) for Internet access. Bear in mind, though, over 98% of US citizens have access to 4G data speeds (per Verizon Wireless). To illustrate the disparity in these speeds: 3G speeds are conventionally around 2 MBPS; 4G is capable of 100 MBPS. As your kids would say, “#FirstWorldProbs”.
You can bet that Google’s aware of what the average connection speed is in your area, so you don’t have to worry about Google being ignorant. Quite frankly, I can only assume that they just don’t care to make it transparent because this approach saves them money. The more they can do to lessen website load sizes and times, the easier it is on their hardware and the more money they save.
Is this the only version of the report?
You’ll notice I mentioned before that Project Lighthouse reports several scores and, yet, Google Page Speed Insights only reports Speed for Mobile and for Desktop. There are a few different methods to run these reports to view these other scores. Along with the conventional online webpage report tool, you can run them via the Lighthouse Chrome Extensionor Chrome’s Developer Tools. This is how you get access to the other audit scores I alluded to previously. The Dev Tools version defaults to a “simulated Fast 3G data connection, 4X CPU Slowdown”. I get similar scores with the Speed/Performance scores of all 3 versions, so it’s fairly safe to assume they’re all based off the same default simulation-judging criteria specifically outlined in the Dev Tools version. That being said, I have witnessed the scores swinging in each version by as many as 8 points by just retesting it. Normally, it’s just by a few points, though.
Since Google doesn’t automatically normalize speed and performance for what’s common in your area, the score can be ridiculously shocking. However, you can manually turn off the “throttling” via the Chrome Developer Tools version and the Performance score will increase significantly (assuming you’re on a solid high-speed connection and your computer is good). I saw one jump from a 28 to 87 (mobile) and 23 to 83 (desktop). By contrast, all the other scores seem to remain the same.
What about the improvement suggestions?
One of the things they recommend in their ‘Opportunities’ section is utilizing different versions of JPEG (2000 or XR) or an image format called ‘WebP’. Admittedly, I’m by no means a graphics expert, but I think I stay fairly “up” on what’s popular and this is the first time I’ve ever heard of WebP. A little digging showed that it’s a format developed by Google (yeah, you can see where this is going). While it has some nice features, it’s got one teensy-weensy little drawback… it’s not supported at all by Safari or Internet Explorer (as well as some other popular browsers). So, unless you want to dynamically swap out a different version of every image file for incompatible browsers, you’re up a creek.
They also suggest deferring loading of offscreen images to save time. Again, if you were on a 3G connection, this may be very impactful but, in our setting, it really wouldn’t equate to more than a drop in the bucket for most websites. In fact, we took into consideration one of their suggestions (“opportunities”) by deferring below the fold images to load later. It made no measurable impact.
I did mention there are other scores given by Project Lighthouse, so I’ll go into this a little now:
- Suggestions mentioned in the ‘Progressive Web App’ section are more for vanity than anything else.
- The content in ‘Accessibility’ might not be a bad idea but is probably not reason for alarm because, as a small local business, you’re probably not a large target for lawsuits like Target or BestBuy would be. The legality behind the concept of ‘Accessibility’ is so subjective, it’s a prosecuting attorney’s dream. There’s no way to fool-proof it to satisfy the law as there is no official definitive standard.
- The ‘Best Practices’ suggestions I’ve found to be just another example of splitting hairs.
- The ‘SEO’ section is the only portion of this whole thing that it would be fairly easy to score a 100% on.
The Final Word
Remember that this is not the end of the world! Take it with a grain of salt. Google even slams itself with the scores and it’s not going to realistically penalize itself so you can probably feel pretty safe. While a hypothetical 100% score across the board is possible, the site would probably just be blank and not really be of any use to anybody. So, be careful not to “teach to the test” and produce a fast, but worthless, product. Remember, your website was created for your customers’ convenience—not Google’s. Keep all this in mind before you see your new score and start preparing to tar and feather your webmaster.Please address all comments or questions regarding this or any other articles in our newsletter to articles@online-access.com.